Retail and e-commerceData and business systems
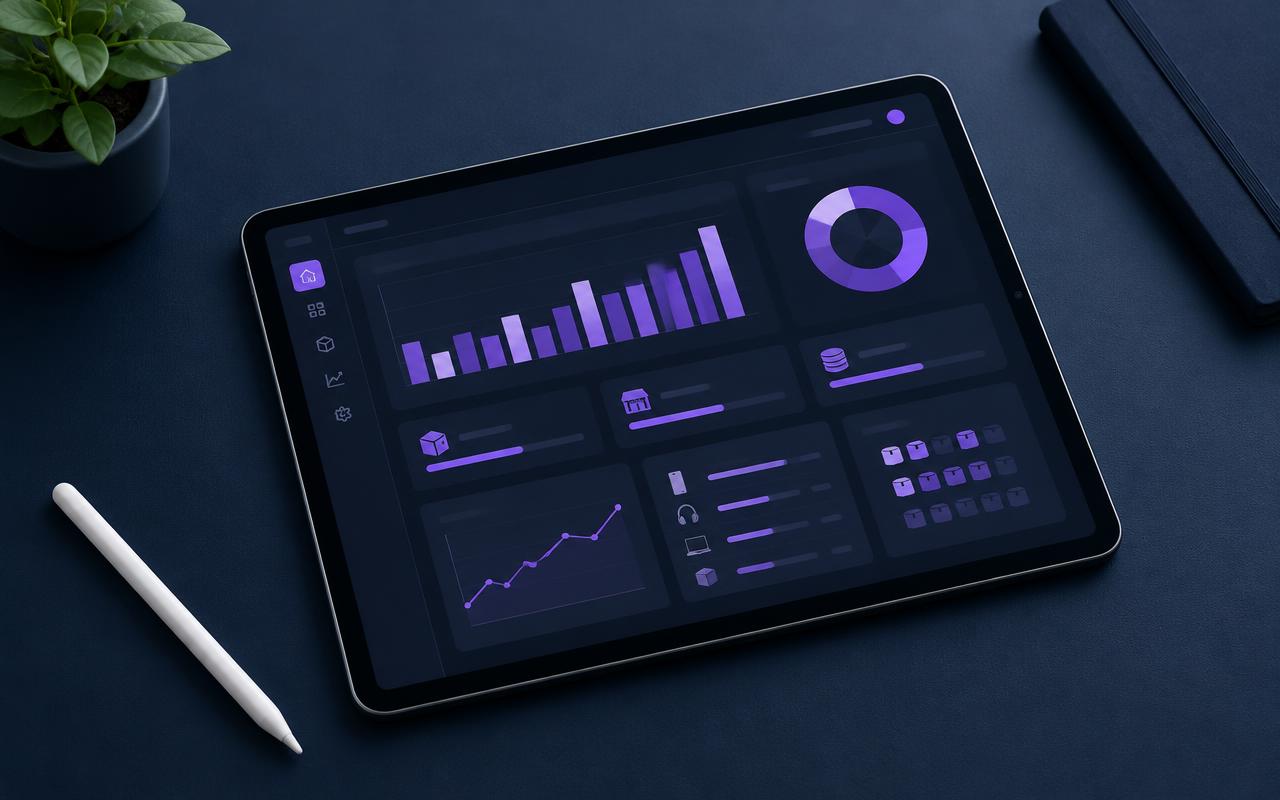
Sample: Retail Inventory Dashboard
A concept dashboard showing stock levels and reorder alerts for a small retailer.

// Data & Business Systems
Databases, dashboards and connected systems that give you a clear view of operations.
The challenge
How we deliver
01
Understand the business, challenges and goals.
02
Define scope, requirements, timeline and budget.
03
Create the user experience and technical approach.
04
Develop, integrate, test and refine the solution.
05
Deploy, monitor and provide agreed ongoing support.
Related work
A concept dashboard showing stock levels and reorder alerts for a small retailer.
FAQ
Tell us what your business needs. We'll help you explore a practical way forward.
Section 4 / Interactive demonstration
Explore fictional business records, filter a source and transform the data into a report.
Select a source and status, switch views and run the pipeline to inspect the filtered output.
FICTIONAL SAMPLE DATA / AMOUNTS IN DEMO UNITS
| Record | Source | Region | Status | Amount |
|---|---|---|---|---|
| D-101 | Application | North | Paid | 1,200 |
| D-102 | API | South | Pending | 850 |
| D-103 | Application | South | Paid | 2,100 |
| D-104 | External service | North | Paid | 400 |
| D-105 | API | North | Paid | 1,500 |
| D-106 | External service | South | Pending | 600 |
Transformation: select source → filter status → sum amounts → report
Run the pipeline to inspect the final output.
Educational simulation · No external actions or personal data collection.
ENGINEER MY DATA SYSTEM